Best Data Visualization Tools
Compare data visualization tools. Includes pricing and ratings for the top data visualization software companies, along with answers to common questions.
Updated on December 21st, 2023
The SMB Guide is reader-supported. When you buy through links on our site, we may earn an affiliate commission. Learn more
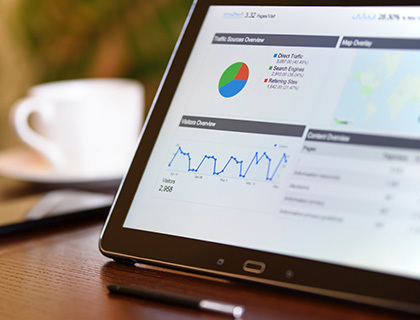
Data visualization tools allow businesses to communicate data in a visual context, for example, via graphs, pie charts, and infographics. It also helps them to identify key performance indicators and make informed decisions based on data insights.
Best Data Visualization Tools:
Rank | Name | Offer | Review | Learn More |
|---|---|---|---|---|
1. | Contact for quote. | The platform offers easy-to-use enterprise planning software and advanced data analytics for multiple operations. | ||
2. | Contact for quote. | The software includes unlimited private maps, full API access, and flexible storage options. | ||
3. | From $439.00 /yr. | Ideal for businesses of all sizes, the platform offers good technical support, advanced mapping, and data exporting tools. | ||
4. | From $10.00 /user /mo. | The software features on-demand, on-cloud, and client-hosted solutions, as well as comprehensive reporting, data discovery, and dashboarding. | ||
5. | Contact for quote. | An intuitive platform that allows users to combine AI-driven analytics into their products and business applications. | ||
6. | From $180.00 /yr. | The software includes various deployment options, end-to-end analytics workflow support, and interactive dashboards. |
FAQs:
What is the best data visualization tool?
Which tools do you recommend for big data visualization?
What is data visualization?
Data visualization enables businesses to visually communicate complex data that might otherwise not be noticed or understood as text information. Statistical and numerical data are commonly visualized while infographics allow businesses to communicate information about their brand in a way that is eye-catching and interesting to customers.
What is the price range of data visualization tools?
Data visualization tools range from free to $500.00 per month, depending on the number of users.

Are there any big data visualization tools available online?
Is there open source data visualization software?
Are there data visualization apps?
Yes, there is a range of apps available, such as Microsoft BI. Some providers also offer mobile-friendly data visualization solutions.
